Training Course on AI for Financial Data Dashboarding with Excel
Training course on AI for Financial Data Dashboarding with Excel equips professionals with the skills to leverage AI-driven tools within Excel for enhancing financial dashboard reporting, predictive analytics, and automation.
Skills Covered
Course Overview
Training Course on AI for Financial Data Dashboarding with Excel
Introduction:
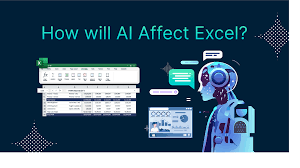
Artificial Intelligence (AI) is reshaping the world of finance, and the integration of AI with Excel to create powerful financial data dashboards is at the forefront of this transformation. Financial analysts and data-driven professionals are increasingly adopting AI technologies to automate, analyze, and visualize complex financial data, improving decision-making and performance tracking. Training course on AI for Financial Data Dashboarding with Excel equips professionals with the skills to leverage AI-driven tools within Excel for enhancing financial dashboard reporting, predictive analytics, and automation. Participants will gain hands-on experience with AI models that seamlessly integrate with Excel, delivering real-time data insights, forecasting trends, and optimizing business outcomes.
As businesses demand smarter and more dynamic financial insights, this course prepares individuals to master AI-powered financial data dashboarding. The course covers advanced Excel features, machine learning models, data visualization, and predictive analytics, empowering learners to create dashboards that not only reflect current financial status but also forecast future financial trends. By the end of this course, participants will be proficient in applying AI techniques in Excel to automate data processing, enhance financial visualizations, and create dashboards that support strategic financial decision-making.
Course Objectives:
- Understand the integration of AI in Excel for financial data analysis.
- Learn how to automate data cleaning and preparation using AI models.
- Master the fundamentals of machine learning algorithms for financial forecasting.
- Develop financial dashboards with AI-driven insights in Excel.
- Gain proficiency in using Excel formulas and AI functions for data analysis.
- Build predictive financial models with historical data for trend forecasting.
- Learn to create interactive and visually appealing financial dashboards.
- Implement AI-based anomaly detection to identify financial irregularities.
- Understand AI-driven automation for reducing manual data entry in financial reports.
- Explore the use of data mining techniques to extract valuable insights from financial data.
- Learn advanced Excel features like Power Query and Power Pivot for financial dashboarding.
- Develop skills in visual storytelling to present AI-generated financial data effectively.
- Gain hands-on experience with case studies to apply AI tools in real-world financial scenarios.
Target Audience:
- Financial Analysts
- Data Scientists working with financial data
- Business Intelligence Professionals
- Excel Enthusiasts
- Financial Controllers
- Chief Financial Officers (CFOs)
- Investment Analysts
- Data Analysts in Finance
Course Duration: 5 days
Course Modules:
Module 1: Introduction to AI in Financial Data Dashboarding
- Understanding AI and its role in financial analysis
- Overview of Excel's capabilities for AI integration
- Tools for incorporating AI into Excel
- AI-powered automation in financial reports
- Case Study: Automating monthly financial reports with AI
- Practical session: Integrating AI models into Excel for data analysis
Module 2: Preparing Financial Data for AI Modeling in Excel
- Data cleaning and preprocessing using AI
- Dealing with missing data and outliers in financial datasets
- Utilizing Power Query for data transformations
- Feature selection for financial data analysis
- Case Study: Preparing stock market data for forecasting
- Hands-on practice: Cleaning and preparing financial data in Excel
Module 3: Machine Learning Basics for Financial Forecasting
- Introduction to machine learning algorithms
- Supervised vs. unsupervised learning in financial forecasting
- Building simple predictive models in Excel
- Training models using historical financial data
- Case Study: Predicting quarterly revenue using machine learning
- Practical session: Implementing machine learning in Excel for revenue forecasting
Module 4: Creating AI-Driven Financial Dashboards
- Principles of financial dashboard design
- AI-driven data visualization techniques
- Using Excel's built-in functions for real-time data updates
- Designing interactive and dynamic financial dashboards
- Case Study: Building a financial dashboard for business performance
- Hands-on practice: Creating an AI-powered financial dashboard in Excel
Module 5: Advanced Excel Features for AI Models
- Power Query and Power Pivot for AI modeling
- Using AI functions within Excel for complex data analysis
- Excel VBA for automating AI-driven financial processes
- Managing large datasets efficiently in Excel
- Case Study: Automating the generation of financial models using Excel macros
- Practical session: Implementing Power Query and Power Pivot with AI models
Module 6: Predictive Analytics and Trend Forecasting in Excel
- Understanding predictive analytics for financial forecasting
- Implementing AI models for trend analysis and forecasting
- Using historical financial data to predict future trends
- Visualizing predicted data in interactive dashboards
- Case Study: Forecasting cash flow using predictive analytics
- Practical session: Creating predictive models in Excel for financial forecasting
Module 7: Anomaly Detection in Financial Data Using AI
- Introduction to anomaly detection techniques
- AI models for detecting financial irregularities
- Using Excel to build anomaly detection systems
- Improving financial accuracy with automated alerts
- Case Study: Identifying fraudulent transactions using AI
- Practical session: Building an anomaly detection model in Excel
Module 8: Real-World Applications and Future Trends in AI Financial Dashboarding
- Exploring real-world AI applications in finance
- Understanding future trends and innovations in financial AI
- Integrating AI with other business intelligence tools
- Real-life case studies of successful AI dashboard implementation
- Case Study: AI-driven financial dashboards for investment firms
- Practical session: Creating a comprehensive financial dashboard using AI
Training Methodology:
- Interactive Lectures
- Hands-on Excel Exercises
- Case Study Discussions
- Group Projects for Real-World Applications
- AI Model Implementations in Excel
- Continuous Feedback and Support
Register as a group from 3 participants for a Discount
Send us an email: info@datastatresearch.org or call +254724527104
Certification
Upon successful completion of this training, participants will be issued with a globally- recognized certificate.
Tailor-Made Course
We also offer tailor-made courses based on your needs.
Key Notes
a. The participant must be conversant with English.
b. Upon completion of training the participant will be issued with an Authorized Training Certificate
c. Course duration is flexible and the contents can be modified to fit any number of days.
d. The course fee includes facilitation training materials, 2 coffee breaks, buffet lunch and A Certificate upon successful completion of Training.
e. One-year post-training support Consultation and Coaching provided after the course.
f. Payment should be done at least a week before commence of the training, to DATASTAT CONSULTANCY LTD account, as indicated in the invoice so as to enable us prepare better for you.